Actually, quite a lot happens to your cells in those 30 seconds — and in the minutes that follow. This article documents exactly what changes, how fast, and what it means for your data.
The Sequence of Events — Second by Second
Door opens
Warm, humid, CO₂-rich air begins mixing with ambient room air immediately. The equilibrium is disrupted at the moment the seal breaks.
CO₂ concentration begins dropping
CO₂ diffuses out rapidly. Medium pH begins shifting alkaline — visible as a color change in phenol red medium from orange toward pink. Cells experience pH change within seconds of door opening.
Temperature drops 1–3°C
Plates cool rapidly on the incubator shelf as warm air is displaced. The temperature drop is fastest at the periphery of the incubator and in plates positioned near the door.
Incubator begins recovery
CO₂ injector activates. Heater compensates. But recovery is not instantaneous — it takes minutes for conditions to restabilize throughout the incubator.
CO₂ recovers to target level
Depending on incubator volume and efficiency, CO₂ typically takes 5–15 minutes to return to 5%. During this period, medium pH remains shifted and cells are in suboptimal conditions.
Temperature fully recovers
Temperature recovery typically lags behind CO₂ recovery. Cells that remained in the incubator during door opening experience this full recovery period at sub-optimal temperature.
What Cells Actually Experience
pH shift — the fastest effect
CO₂ dissolved in medium maintains pH around 7.4 in standard bicarbonate-buffered media. When CO₂ drops, the equilibrium shifts and pH rises toward alkaline. Even a shift of 0.1–0.2 pH units activates pH-sensitive signaling pathways. For migration experiments, pH changes alter integrin clustering, lamellipodia dynamics, and chemotactic sensitivity — all within minutes.
Temperature effect on cytoskeleton
Actin dynamics are highly temperature-sensitive. A drop of 2°C slows actin polymerization measurably and reduces migration velocity. For cells at the wound edge in an active migration assay, a brief temperature drop introduces a pause in migration that appears in the data as reduced closure rate at that timepoint — without any biological cause.
The compounding effect across multiple timepoints
A standard wound healing assay imaged at T=0, T=6h, T=12h, and T=24h involves the plate leaving and returning to the incubator four times — plus the initial wounding procedure. Each exit event disrupts conditions. Each return triggers a recovery period. The cumulative effect on cells remaining in the incubator (from repeated door openings) is rarely quantified but real.
Systematic error: If you are comparing two conditions in the same 24-well plate and imaging sequentially at each timepoint, wells imaged early versus late in the imaging session experience different cumulative transport effects. This creates a systematic positional bias that is difficult to detect and rarely reported.
What This Means for Your Data
- Wound healing assays: Migration velocity at each timepoint is partly a function of how recently the plate was transported — not just the biology
- Confluency monitoring: The moment you check confluency manually is not the moment cells were at that density — equilibration time adds measurement error
- Cytotoxicity: Drug response kinetics measured at fixed timepoints are confounded by transport stress at each measurement
- Differentiation assays: pH and temperature perturbations activate stress responses that can accelerate or delay differentiation independent of the experimental variable
The Solution: Image Without Opening the Door
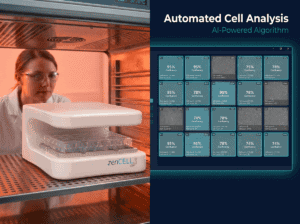
In-incubator imaging eliminates every one of these effects. The imaging system sits inside the incubator, images all 24 wells simultaneously at every timepoint, and never requires the door to be opened. From T=0 to the final timepoint, cells experience constant temperature, constant CO₂, and constant humidity — exactly the conditions your protocol specifies.
Zero door openings — see it live
Free 30-min demo showing continuous imaging inside a real CO₂ incubator.
Häufig gestellte Fragen
Does HEPES buffer solve the CO₂ problem during transport?
Partially. HEPES-buffered media maintains pH more stably during CO₂ loss than standard bicarbonate-buffered media, which is why it is commonly used for transport and imaging outside the incubator. However, HEPES does not eliminate temperature effects, mechanical vibration during transport, or the repeated disruption of returning cells to the incubator. In-incubator imaging eliminates the need for buffer substitution entirely.
How much does incubator opening actually affect migration speed?
The exact effect depends on cell type, media composition, and incubator recovery kinetics. For cells sensitive to pH and temperature — including most primary cells, iPSC-derived cultures, and neuronal cells — even brief excursions outside the incubator are measurable. For robust established cell lines (HeLa, HEK293), the effect is smaller but still present. The key issue is not the magnitude but the systematic nature of the effect: it occurs at every timepoint, introducing a consistent confound.
If I use HEPES and image quickly, is transport OK?
For single-timepoint or short experiments in robust cell lines, yes — controlled transport with HEPES-buffered media is acceptable. For multi-timepoint long-term experiments, for primary or sensitive cells, or for experiments where migration kinetics are the primary readout, in-incubator imaging provides meaningfully better data quality.