Wound Healing Assay · ImageJ Analysis · Quantification
How to Quantify a Wound Healing Assay in ImageJ — % Closure, Wound Rate & Relative Wound Density
Getting reproducible images is only half the problem in wound healing assay analysis. The other half is turning those images into quantitative, comparable data. This guide covers the three main metrics — % wound closure, wound closure rate, and relative wound density — and how to calculate each one in ImageJ/Fiji with and without automation.
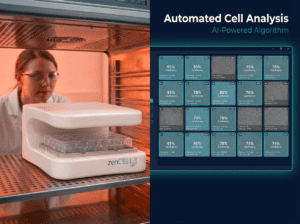
Wound healing assays are quantified using three metrics: % wound closure (area-based, most common), wound closure rate in µm²/h (speed), and relative wound density (RWD, accounts for proliferation). In ImageJ, use the free Wound Healing Size Tool plugin — draw an ROI around the wound, measure area at T=0 and each timepoint, calculate % closure from the formula. For automated analysis of all 24 wells, zenCELL owl calculates all three metrics continuously without manual intervention.
The Three Metrics You Need
% Wound Closure
(A₀ − Aₜ) / A₀ × 100
Most widely used. Area-based. Easy to calculate in ImageJ. Does not distinguish migration from proliferation.
Wound Closure Rate
ΔArea / Δtime (µm²/h)
Speed of closure. More informative for drug effects on migration velocity. Requires multiple timepoints.
Relative Wound Density
ρ_wound / ρ_monolayer × 100
Accounts for proliferation. Used by Incucyte. Requires cell-density segmentation, not just area measurement.
The Core Formula — % Wound Closure
A₀ is the wound area measured immediately after wound creation — before any migration has occurred. Aₜ is the wound area at each subsequent timepoint. The result is % of the original wound that has been closed by migration (and proliferation).
Common mistake: Some researchers use wound width instead of wound area. Width measurements assume the wound is a perfect rectangle — which it never is, especially with manual scratching. Always measure area, not width, for accurate quantification.
Step-by-Step: ImageJ / Fiji Wound Healing Analysis
The free Wound Healing Size Tool plugin (Suarez-Arnedo et al., PLOS ONE 2020, 900+ citations) is the standard ImageJ method. Install it once and use it across all experiments.
- 1
Install the plugin
Download from ImageJ/Fiji plugin repository. Drag
.jarfile into Fiji → restart. Plugin appears underPlugins → Wound Healing Size Tool. - 2
Open your image series
Open T=0 image first. Set scale:
Analyze → Set Scale— enter known distance in pixels. This converts pixel measurements to µm². - 3
Draw the ROI at T=0
Use the Rectangle tool to draw a region of interest (ROI) around the wound area. Include the full wound width but exclude the monolayer areas above and below. Save ROI to ROI Manager:
Ctrl+T. - 4
Threshold the wound area
Convert to 8-bit grayscale:
Image → Type → 8-bit. Apply threshold:Image → Adjust → Threshold— adjust until wound zone (cell-free area) is highlighted in red. Cell-covered areas should remain white/grey. - 5
Measure wound area at T=0
Run Wound Healing Size Tool → measure. Note the wound area in µm² — this is your A₀. Record in results table.
- 6
Repeat for each timepoint
Open each subsequent image. Apply the same ROI from the ROI Manager (do not redraw). Apply same threshold settings. Measure → record Aₜ for each timepoint.
- 7
Calculate % closure
In Excel or Prism:
% closure = (A₀ − Aₜ) / A₀ × 100for each timepoint. Plot % closure vs. time to generate the wound closure kinetics curve.
Critical: Always use the same ROI across all timepoints for a given well. Never redraw the ROI between timepoints — this introduces operator variability into the quantification even when the wound creation was standardized.
Relative Wound Density — What It Is and When to Use It
Relative wound density (RWD) was developed by Sartorius as the primary metric for the Incucyte WoundMaker system. Unlike % closure (which measures the area of the gap), RWD measures how densely cells have repopulated the wound zone relative to the surrounding monolayer:
RWD starts at 0% (empty wound) and approaches 100% when the wound zone has the same cell density as the surrounding monolayer. It captures both migration (cells moving into the wound) and proliferation (cells dividing in the wound zone) in a single metric.
% Closure vs. Relative Wound Density — When to Use Which
| Criterion | % Wound Closure | Relative Wound Density |
|---|---|---|
| Measures | Cell-free area reduction | Cell density in wound zone |
| Migration vs. proliferation | Cannot distinguish | Accounts for both |
| Software required | ImageJ — free | Cell segmentation software required |
| Meilleur pour | Standard wound healing assay — most publications | Drug screening where proliferation effect is relevant |
| Incucyte compatible | Oui | Primary Incucyte metric |
| zenCELL owl automated | Yes — all 24 wells | Yes — all 24 wells |
Common ImageJ Mistakes and How to Avoid Them
- Inconsistent thresholding — the same threshold setting must be applied to all images in a series. Use
Image → Adjust → Threshold → Apply to all slicesfor image stacks. - Redrawing the ROI — always save the T=0 ROI and reuse it. Any shift in ROI position introduces systematic error.
- Stage drift between timepoints — if imaging manually, check that the same field of view is captured at each timepoint. Even small drift changes apparent wound area without real biology.
- Measuring width instead of area — wound width measurement assumes a rectangular wound, which is never exact. Always use area (µm²).
- Forgetting the scale calibration — measurements in pixels are not comparable between microscopes or magnifications. Always calibrate scale before measuring.
When to Switch to Automated Analysis
ImageJ analysis is practical for small experiments — 2–3 wells, 3–4 timepoints. As soon as you scale to 24-well plates with continuous time-lapse, manual ImageJ becomes the bottleneck. A 24-well plate imaged every 30 minutes for 24 hours generates 48 images per well — 1,152 images per plate. Manual analysis of this dataset takes days.
zenCELL owl calculates wound area, % closure, wound closure rate (µm²/h), and t½ gap closure time automatically for all 24 wells at every timepoint — generating the complete results table without manual measurement. Data exports directly to CSV for GraphPad Prism, Excel, or R.
Automate your wound healing assay analysis
zenCELL owl — 24 wells, continuous, automated gap closure analysis. Free 30-min demo.
Foire aux questions
Is the scratch assay the same as the wound healing assay?
Yes — “scratch assay” and “wound healing assay” refer to the same basic experiment. “Scratch assay” typically describes the manual pipette tip method; “wound healing assay” is the broader term covering all wound creation approaches including photochemical, insert-based, and mechanical methods. The quantification methods described here apply to all variants.
How long does a wound healing assay take to analyze in ImageJ?
Manual ImageJ analysis of a single well with 4 timepoints takes approximately 5–10 minutes including thresholding and measurement. For a 24-well plate with 4 timepoints, that is 2–4 hours of analysis time per experiment. The Wound Healing Size Tool plugin reduces this to approximately 2–3 minutes per well with practice.
Can I use Fiji instead of ImageJ?
Yes — Fiji (Fiji Is Just ImageJ) is the recommended distribution. It includes all standard ImageJ plugins pre-installed and has better macro support. The Wound Healing Size Tool plugin is compatible with both ImageJ and Fiji.
How do I calculate wound closure rate?
Wound closure rate (µm²/h) = (A₀ − Aₜ) / time elapsed in hours. For a linear phase of wound closure (typically the first 6–12 hours), this gives the migration velocity. For non-linear kinetics, calculate the rate between consecutive timepoints and plot rate vs. time to show acceleration or deceleration of migration.