Confluency Monitoring · Cytotoxicity · Live Cell Microscopy
Automated Confluency Monitoring and Cytotoxicity Assays — Why Live Cell Imaging Changes Everything
Manual confluency assessment — looking through the microscope eyepiece and estimating “about 80%” — is one of the most common sources of experimental variability in cell biology. Similarly, endpoint cytotoxicity assays (MTT, CCK-8) miss the kinetics of cell death entirely. Live cell imaging solves both problems by providing continuous, quantitative, automated data on cell density and viability over time.
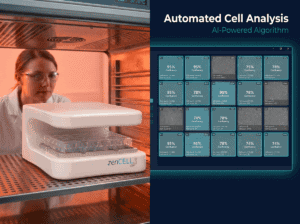
Automated confluency monitoring uses brightfield time-lapse imaging and image analysis software to continuously measure the percentage of well surface covered by cells. Cytotoxicity live cell assays track cell morphology and density changes over time after compound treatment — providing IC50 kinetics that endpoint assays cannot capture. Both assays run without removing cells from the incubator, maintaining physiological conditions throughout.
Why Manual Confluency Assessment Fails
Every cell biology protocol says “seed cells to ~80% confluency” or “grow to full confluency before wounding.” But what does 80% confluency actually look like? Ask five researchers and you will get five different answers — and five different starting conditions for your experiment.
Manual confluency estimation introduces:
- Inter-operator variability — subjective visual assessment differs between individuals
- Temporal variability — cells are checked at fixed timepoints (morning/afternoon), missing the exact moment of optimal density
- Disturbance — removing the plate from the incubator for each visual check disrupts temperature and CO₂
- No kinetic data — you know density at a single timepoint, not the growth curve
Automated Confluency Monitoring — How It Works
In-incubator brightfield imaging captures images of each well at defined intervals — typically every 15–60 minutes. Image analysis software segments each image into cell-covered and cell-free regions using edge detection and texture analysis algorithms, calculating % confluency at each timepoint.
The result is a continuous growth curve per well — showing doubling time, growth rate, lag phase, and the exact moment of optimal confluency. For wound healing assays, this data directly informs the optimal time to create the wound: when all 24 wells have reached ≥95% confluency simultaneously.
Key Advantages Over Manual Assessment
- Objective, reproducible measurement independent of operator
- Continuous data — not just snapshots at fixed timepoints
- Cells never leave the incubator — no environmental disturbance
- All 24 wells monitored simultaneously — comparable growth curves per condition
- Automated alerts when target confluency is reached
Live Cell Cytotoxicity Assays
Traditional cytotoxicity assays (MTT, WST-1, CCK-8) are endpoint assays: cells are treated with a compound, incubated for a fixed period (typically 24h or 72h), and then a colorimetric reagent is added to measure metabolic activity as a proxy for cell viability. This approach has two fundamental limitations:
- No kinetic data — you see the final state, not when toxicity began, how fast it progressed, or whether cells recovered
- Metabolic bias — metabolic activity is not the same as cell number or viability; compounds that alter metabolism confound results
Label-Free Brightfield Cytotoxicity
Brightfield live cell imaging-based cytotoxicity measures cell confluency (a proxy for cell number) and morphology changes over time after compound addition. This provides:
| Readout | Live Cell Imaging (Brightfield) | MTT / CCK-8 (Endpoint) |
|---|---|---|
| Kinetic data | Full time course — onset, progression, recovery | Single endpoint only |
| IC50 calculation | IC50 at any timepoint — full temporal IC50 curve | IC50 at one fixed timepoint |
| Metabolic bias | None — measures cell density directly | Yes — metabolic activity ≠ cell number |
| Reagent cost | Zero — label-free | Colorimetric reagent required per timepoint |
| Parallel conditions | 24 concentrations simultaneously | Sequential — plate reader per timepoint |
| Reversibility detection | Yes — tracks recovery after compound removal | No — endpoint only |
Cytostatic vs. Cytotoxic — The Critical Distinction
Live cell imaging is the only assay format that reliably distinguishes cytostatic effects (compound slows growth without killing cells) from cytotoxic effects (compound actively kills cells). In an endpoint assay, both appear as reduced confluence — but their mechanisms and drug development implications are completely different. Kinetic confluency curves reveal this distinction immediately: cytostatic compounds plateau growth; cytotoxic compounds cause active decline.
Application: For cancer drug screening, the distinction between cytostatic and cytotoxic mechanisms is clinically meaningful. Live cell brightfield imaging provides this data automatically from the same experiment — no additional assay required.
Running Both Assays Simultaneously
A key advantage of in-incubator brightfield imaging is the ability to run confluency monitoring and cytotoxicity assays in the same experiment — using different wells of the same 24-well plate. Wells 1–8 receive vehicle control, wells 9–16 receive compound at increasing concentrations, and wells 17–24 receive a positive control. All 24 wells are monitored continuously from the same device, under identical physiological conditions.
See automated confluency monitoring live
Free 30-min demo — zenCELL owl imaging 24 wells simultaneously, inside a real incubator.
常见问题解答
What confluency should cells be at for a scratch assay?
Cells should be at ≥95% confluency before wound creation in a scratch assay. Below this threshold, the monolayer has gaps that are indistinguishable from the wound, and cell-cell contact-inhibited migration behavior is not fully established. Automated confluency monitoring ensures all wells reach this threshold before the experiment begins.
Can I use the same plate for confluency monitoring and wound healing assay?
Yes — this is the standard workflow with zenCELL owl and ScratchMaker Plates. The device monitors confluency during cell growth, alerts when ≥95% is reached, and then continues imaging after photochemical wound creation — generating a continuous dataset from seeding to wound closure in a single experiment.
How accurate is automated confluency measurement?
Automated brightfield confluency measurement typically achieves ±2–5% accuracy compared to manual expert assessment, with the advantage of being fully reproducible between measurements and operators. Manual visual estimation has ±10–20% variability between operators.