Spheroid Growth · 3D Cell Culture · Live Cell Imaging
Spheroid Growth Assays — How to Monitor 3D Cell Cultures with Brightfield Live Cell Imaging
Tumor spheroids and 3D cell culture models are increasingly replacing 2D monolayer assays in cancer drug screening and toxicology — they better recapitulate the architecture, oxygen gradients, and drug penetration characteristics of solid tumors in vivo. Live cell brightfield imaging has emerged as the standard method for non-destructive, continuous spheroid monitoring, providing growth kinetics and drug response data that endpoint assays cannot capture.
Spheroid growth assays monitor 3D cell aggregates over time using brightfield time-lapse imaging. Spheroid diameter, cross-sectional area, and necrotic core formation are quantifiable without staining. In-incubator imaging systems allow 24 spheroids to be monitored simultaneously under stable physiological conditions — eliminating the environmental disturbance of repeated plate removal for manual imaging.
Why 3D Spheroids Outperform 2D Monolayers for Drug Screening
Standard 2D monolayer cultures are highly proliferative, uniformly oxygenated, and lack the multicellular architecture of solid tumors. Spheroids address several key limitations:
The three-zone architecture of mature spheroids (>200 µm diameter) — proliferating outer rim, quiescent intermediate zone, necrotic core — closely mimics avascular tumor regions. Drugs that penetrate poorly will show activity against outer proliferating cells but fail to reach the quiescent and necrotic zones — a key mechanism of clinical drug resistance that 2D assays miss entirely.
Brightfield Imaging for Spheroid Growth Monitoring
Brightfield microscopy is ideally suited for spheroid growth assays because:
- Spheroid boundaries are clearly visible without staining — the dense cell aggregate provides strong contrast against the surrounding medium
- Necrotic core formation appears as a darker, less refractive central region visible in brightfield
- No phototoxicity from fluorescent excitation — safe for multi-day experiments
- No fluorescent probe required — reduces cost and eliminates probe-related artifacts
- Standard image analysis algorithms (area, diameter, roundness) are directly applicable
Key Readouts from Brightfield Spheroid Imaging
- Spheroid diameter / area — primary growth metric, calculated at each timepoint
- Growth rate — doubling time and growth kinetics from area-over-time curves
- Necrotic core ratio — dark core area / total area — increases as spheroid grows
- Spheroid compactness / roundness — changes indicate structural disintegration or invasion
- Drug response onset — exact timepoint when growth inhibition begins
Spheroid Formation Methods
| 方法 | Advantages | Limitations |
|---|---|---|
| Ultra-low attachment plates (ULA) | Uniform single spheroid per well; scalable to 96-well; compatible with in-incubator imaging | Requires ULA-coated plates; spheroid size varies by seeding density |
| Hanging drop | Very uniform spheroids; no special coating needed | Difficult to image in situ; not compatible with automated imaging; low throughput |
| Agarose overlay | Simple; no special equipment | Multiple spheroids per well; variable size and position; difficult to image consistently |
| Spinner flask / bioreactor | Large scale; good oxygen distribution | Not compatible with well-plate imaging; requires specialized equipment |
Continuous Spheroid Monitoring — Why In-Incubator Imaging Is Essential
Spheroid growth assays typically run for 5–14 days — far longer than standard 2D assays. This makes environmental stability even more critical. Every plate removal for manual imaging causes:
- Temperature equilibration time of 10–15 minutes after return to incubator
- CO₂ loss and medium pH shift
- Mechanical disturbance that can detach loosely aggregated spheroids from ULA surfaces
- Risk of contamination with each incubator opening
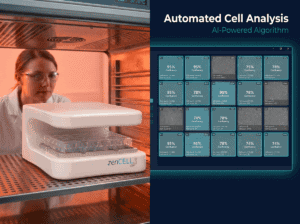
In-incubator brightfield imaging eliminates all of these perturbations. zenCELL owl images all 24 wells simultaneously every 1–60 minutes for the full duration of the experiment, generating complete growth curves per well without any manual intervention.
Combined assay workflow: Run wound healing assay (scratch assay) in wells 1–12 and spheroid growth monitoring in wells 13–24 of the same 24-well plate simultaneously — two assays, one device, one experiment. zenCELL owl images all 24 wells independently with separate analysis parameters per well group.
Drug Screening with Spheroid Growth Assays
Spheroid drug screening provides IC50 values with full kinetic resolution — not just a single endpoint measurement. A standard assay design:
- Form spheroids in ULA 24-well plate — typically 500–2,000 cells per well
- Allow spheroids to compact for 48–72 hours (monitoring growth)
- Add compound at T=0 in 6–8 serial dilutions across wells
- Monitor growth continuously for 5–7 days — generate area-over-time curves per concentration
- Calculate GI50 (50% growth inhibition) and TGI (total growth inhibition) from kinetic curves
Monitor 24 spheroids simultaneously
zenCELL owl inside your incubator — brightfield, 24 wells, continuous. Free demo available.
常见问题解答
How large should spheroids be before starting drug treatment?
Spheroids should be 200–400 µm in diameter before drug treatment — at this size, the three-zone architecture (proliferating rim, quiescent zone, necrotic core) is typically established, making the model most physiologically relevant. Smaller spheroids lack the oxygen gradient; larger spheroids may begin to disintegrate.
Can I use zenCELL owl for spheroid imaging in 96-well plates?
zenCELL owl is optimized for 24-well plate format. For 96-well spheroid imaging with full plate automation, the zenCELL owl Scan HTS variant (XYZ stage) handles 96-well plates in under 90 seconds per scan. Contact us to discuss your specific HTS spheroid application.
What cell seeding density should I use for spheroid formation?
Seeding density for uniform spheroid formation varies by cell line: aggressive cancer lines (MDA-MB-231, A549) typically require 500–1,000 cells per well; slower-growing lines (MCF-7, HCT116) may need 1,000–2,000 cells. Always perform a seeding density titration to identify the density that produces compact, uniform spheroids of 200–400 µm diameter after 48–72h of aggregation.
How do I distinguish spheroid area from necrotic core in brightfield images?
The necrotic core appears as a darker, more opaque region in the center of the spheroid in brightfield images — the result of cellular debris and reduced refractive index compared to the surrounding viable cells. Automated image analysis software segments total spheroid area and inner dark zone separately, providing necrotic core ratio as an additional readout. The zenCELL owl analysis software includes this segmentation automatically.