Cancer Cell Migration Assay: How to Get Reproducible Data for Drug Screening
⏱ 7 min read
🔬 Cancer Metastasis · Anti-Migratory Compounds
To get reproducible cancer cell migration data for drug screening, standardize wound creation to below 5% inter-well variability, use continuous time-lapse imaging to capture kinetic migration curves rather than single endpoints, and select an ECM coating matched to your cancer cell line. Manual pipette scratch assays introduce variability that exceeds most drug effect sizes, making false negatives the primary risk in anti-migratory compound screening.
Cancer metastasis — the migration of tumor cells from primary to secondary sites — is responsible for over 90% of cancer-related deaths. Studying the migratory behavior of cancer cells in vitro and identifying compounds that inhibit it is one of the most active areas of oncology drug discovery. Yet the assay most commonly used for this purpose, the manual scratch assay, has a reproducibility problem that undermines screening campaigns before they begin.
A wound width CV of 30%+ with manual pipette scratching means that any drug effect smaller than 30% cannot be statistically distinguished from assay noise. Most anti-migratory compounds produce effects in the 15–25% range at relevant concentrations — rendering them invisible in non-standardized assays.
Cancer Cell Lines: Migration Rates & Assay Considerations
| Cell Line | Cancer Type | Migration Rate | Recommended ECM | Wound Closure (24h) |
|---|---|---|---|---|
| MDA-MB-231 | Breast (triple-negative) | Fast | Fibronectin | ~80% |
| MCF-7 | Breast (ER+) | Slow | Collagen I | ~30% |
| A549 | Lung adenocarcinoma | Fast | Fibronectin | ~75% |
| HT-1080 | Fibrosarcoma | Very fast | Fibronectin or none | ~90% |
| HCT116 | Colorectal | 中等 | Collagen IV | ~55% |
| PC-3 | Prostate | 中等 | Fibronectin | ~50% |
| U87-MG | Glioblastoma | 中等 | Laminin | ~45% |
Why Drug Screening Fails Without Kinetic Data
Most anti-migratory compound screens use a T=0 and T=24h endpoint design. This approach misses three critical phenomena:
1. Delayed Drug Response
Many kinase inhibitors and cytoskeletal drugs show their peak anti-migratory effect in the first 4–8 hours as cells adapt to treatment. By T=24h, partial recovery is common. An endpoint at 24h shows a modest effect; a kinetic curve reveals the true inhibition peak and recovery dynamics — essential data for dosing decisions.
2. Cytostatic vs. Cytomigratory Effects
Endpoint assays cannot distinguish between a compound that slows migration and one that simply slows proliferation, reducing cell density in the wound zone. Kinetic data with proliferation controls — or relative wound density measurements — resolves this ambiguity. Without kinetics, you may advance cytostatic compounds as anti-migratory hits.
3. Serum Sensitivity
Cancer cell migration is highly sensitive to serum concentration. A 1% variation in FBS between wells produces migration rate differences of 10–15% — larger than many drug effects. Standardized plates with consistent surface chemistry reduce this batch-to-batch variability.
Standardized Drug Screening Protocol — Cancer Migration
Seed cancer cells on ScratchMaker plates with ECM coating
Select ECM coating based on cell line (table above). Seed at appropriate density for 95%+ confluence within 24h. Use serum-reduced medium (0.5–1% FBS) 12h before wound creation to synchronize cells and reduce proliferation background.
Create photochemical wound at T=0
Apply light mask, expose to ~395 nm light for 60 sec/well. Uniform wound geometry across all 96 wells — no operator variability. Immediately add compound treatment at desired concentrations.
Begin time-lapse imaging immediately
Place in incubator imager at T=0. Capture images every 30–60 min. Do not disturb plate — in-incubator imaging maintains 37°C / 5% CO₂ throughout.
Automated gap closure analysis per well
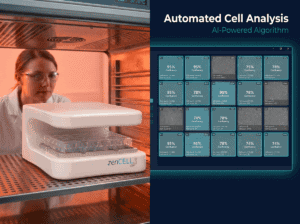
AI software generates wound closure curves for every well automatically. Extract: wound closure rate, migration velocity, T50 (time to 50% closure), and relative wound density. Export to statistical analysis software.
Calculate dose-response and kinetic IC50
Plot wound closure rate vs. compound concentration at multiple timepoints. Kinetic IC50 curves reveal optimal dosing windows and distinguish cytostatic from anti-migratory mechanisms.
Key Readouts for Anti-Migratory Drug Screening
Common Cell Lines for Anti-Migratory Compound Screening
For primary drug screening campaigns, fast-migrating triple-negative breast cancer lines (MDA-MB-231) and lung cancer lines (A549) offer the largest detection window — making it easier to detect inhibitory effects statistically. Combine with a slow-migrating positive control line (MCF-7) to confirm mechanism specificity.
For CNS tumor research, U87-MG glioblastoma cells on Laminin-coated ScratchMaker plates show consistent migration kinetics suitable for compound profiling in 24-well format.
Screen anti-migratory compounds with confidence
ScratchMaker Plates — photochemical wound creation, from €59. 6-, 24-, 96-well formats.