Real-Time vs. Fixed-Point Imaging in Wound Healing Assays — What You’re Missing
⏱ 6 min read
🔬 Time-Lapse Imaging · Cell Migration Monitoring
Real-time monitoring captures the full kinetic profile of cell migration, revealing transient behaviors, migration velocity peaks, and drug response delays that fixed-point imaging systematically misses. With only 2–3 endpoint measurements, you cannot reconstruct the actual wound closure curve — and you risk drawing conclusions from a single timepoint that is unrepresentative of the biological process.
Most wound healing assays are still conducted with fixed-point imaging: a photo at T=0 immediately after wound creation, then again at T=24h or T=48h. This approach made sense when continuous imaging was technically impossible — but it introduces significant blind spots in your migration data that can mask drug effects, mischaracterize cell behavior, and produce irreproducible results between labs.
Here is a direct comparison of what each approach captures — and what it misses.
Fixed-Point vs. Real-Time: Side-by-Side Comparison
| Criterion | Fixed-Point (Endpoint) | Real-Time (Time-Lapse) |
|---|---|---|
| Data points per experiment | 2–3 timepoints | Continuous — 1 image/15 min typical |
| Migration velocity | Approximated from endpoints only | Calculated per timepoint, full kinetic curve |
| Transient behaviors | Invisible — missed between endpoints | Fully captured — speed changes, pauses, bursts |
| Drug response timing | Unknown — effect present, onset unclear | Precise — onset, plateau, and reversal visible |
| Cell handling | Plate removed from incubator repeatedly | Imaging inside incubator — no disturbance |
| Physiological conditions | Disrupted at each measurement | Maintained continuously at 37°C / 5% CO₂ |
| Sample size needed | Higher n to compensate for variability | Lower n — each well is its own kinetic control |
| Contamination risk | Elevated — repeated plate transport | Minimal — sealed incubator environment |
The Data You Lose with Endpoint Imaging
Same experiment — different information captured
Fixed-Point (T=0 + T=24h)
2 data points. Migration velocity, early drug effects, and transient behaviors are invisible.
Real-Time Time-Lapse
96 data points (every 15 min). Full wound closure curve, velocity changes, drug onset timing.
What Transient Behaviors Look Like — And Why They Matter
Cell migration during wound healing is not a linear process. Cells at the leading edge exhibit intermittent bursts of migration, periods of reorganization, and velocity changes that depend on signaling from the wound microenvironment. Fixed-point imaging cannot distinguish between a compound that slows migration uniformly versus one that blocks an initial acceleration phase only.
Drug Screening: The Hidden Timing Problem
In compound screening for pro- or anti-migratory effects, the timing of drug response onset is often as biologically relevant as the magnitude. A compound that inhibits migration at T=4h but shows recovery by T=16h will appear as a moderate inhibitor at the T=24h endpoint — masking what could be a mechanistically important transient effect.
“Without kinetic data, you’re essentially drawing a straight line between two points and calling it a migration curve. That works until your drug effect is non-linear — which most biologically interesting effects are.”
— Common observation in live cell imaging literature on scratch assay methodology
When to Use Each Approach
Fixed-Point May Suffice
Simple qualitative comparison of two conditions. No drug treatment. Large expected effect size (>50% difference in wound closure). Preliminary screening where throughput is the priority.
Real-Time Required
Drug/compound screening where response timing matters. Small expected effect sizes needing statistical power. Publication-quality data. Any experiment where migration velocity or collective behavior is a readout.
Cancer Metastasis Research
Endpoint data insufficient for characterizing invasive phenotypes. Real-time imaging captures mesenchymal-amoeboid transition events invisible at fixed timepoints.
Angiogenesis & Tissue Repair
Endothelial cell migration and tube formation are highly dynamic. Kinetic data from continuous imaging distinguishes true migration from proliferation-driven gap closure.
In-Incubator Imaging: The Physiological Advantage
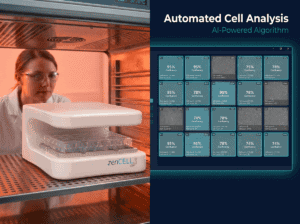
Real-time monitoring requires the imaging system to operate inside the incubator — not adjacent to it. Every time a plate is transported from incubator to microscope for a fixed endpoint measurement, cells experience temperature changes, CO₂ fluctuations, and mechanical disturbance. These are not benign perturbations: they alter actin cytoskeleton dynamics, focal adhesion remodeling, and migration speed in ways that contaminate your endpoint data.
In-incubator brightfield imaging eliminates these artefacts entirely. Cells are imaged in their native 37°C / 5% CO₂ environment without interruption from T=0 to experiment end.
Start capturing full migration kinetics
zenCELL owl — 24-channel brightfield in-incubator imager. From €290/month leasing.