zenCELLOWL · Workflow

Cell Culture Monitoring — Before & After

See how zenCELLOWL transforms your cell therapy manufacturing process — from manual spot-checks to continuous, documented oversight.
⚠ Current Standard Process

Manual monitoring — blind spots, contamination risk, incomplete documentation

Day 0

Cell Seeding

Cells are seeded into flasks or bioreactor after isolation. Initial cell count and viability measured manually at seeding.

⚠ Risk

Baseline only. No documentation of early morphological changes in the first 24–48 h.
Intermittent

Manual Microscopy Checks

Scientist removes flask from incubator and checks cells under an external microscope.
⚠ Problems
Incubator opened → temperature & CO₂ disruption. Contamination risk per opening. No data between checks — changes can go undetected for hours.
Intermittent

Manual Cell Count

Trypan blue exclusion or hemocytometer. Performed at irregular intervals, highly operator-dependent.
⚠ Problems

High variability between operators. No continuous growth curve. Missed optimal passage / harvest time points.
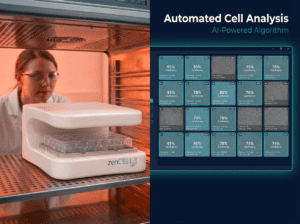
Reactive

Contamination Detection

Contamination is detected visually — often after it has already spread. Media colour change or turbidity is noticed during a routine check.
⚠ Problems
By the time it’s detected, hours or days of culture — and potentially the entire batch — are lost. No early warning system.
Endpoint Only

Potency / Cytotoxicity Test

CAR-T cells co-cultured with tumor targets. Readout is an endpoint assay (e.g. LDH release) at a fixed time point.
⚠ Problems
Single time point only — killing kinetics and dynamics are invisible. Requires additional assay kits and consumables.
Manual

GMP Documentation

Data entered manually into paper or spreadsheet batch records. Photos taken ad hoc with smartphone.
⚠ Problems
Incomplete, non-standardised records. Time-consuming. Difficult to defend during FDA / EMA audits. Gaps in traceability.

✦ With zenCELLOWL

Continuous, automated, fully documented — inside the incubator, without disruption

Day 0

Cell Seeding

Cells seeded as normal. zenCELLOWL is already positioned in the incubator — imaging starts automatically at T=0.

✦ Benefit
First image captured within minutes. Morphology and confluence baseline documented automatically — no manual step required.
24 / 7

Continuous In-Incubator Imaging

zenCELLOWL captures images at defined intervals — every 30 min, 1 h, or custom — without ever opening the incubator door.
✦ Benefit
Zero temperature or CO₂ disruption. Zero contamination risk from repeated openings. Up to 48× more data points per day vs. manual checks.
AI-Powered

Automated Cell Count & Growth Curve

Custom-trained AI model quantifies confluence, counts cells, and tracks proliferation automatically across the full culture period.

✦ Benefit

Continuous, operator-independent growth curves. Optimal passage and harvest time points are flagged automatically — never missed again.
Proactive

Early Contamination Alert

Morphological deviations, debris accumulation, or abnormal growth patterns are detected within the first imaging interval after onset.

✦ Benefit

Contamination events caught hours earlier. Batch intervention or rescue possible before the culture is lost. Significant cost savings per run.
Time-Lapse

Live Potency / Cytotoxicity Assay

CAR-T / tumor co-culture is imaged continuously. Killing kinetics, cell morphology changes, and effector-to-target dynamics are captured in real time.

✦ Benefit

Full killing curve — not just a single endpoint. Richer potency data with fewer additional reagents. Directly supports product release decisions.
Audit-Ready

Automated GMP Documentation

Every image, timestamp, and analysis result is logged automatically. Exportable batch record with standardised morphology reports and time-lapse data.

✦ Benefit

Complete, traceable documentation — zero manual effort. Fully defensible in FDA and EMA audits. Reduces batch release time significantly.

You are right, if you want:

48×

More imaging data points vs. manual checks

0

Incubator openings for monitoring

100%

Automated batch record documentation

Ready to eliminate the blind spots?

See zenCELLOWL in action in your cell therapy application — live demo available.
Vista en vivo

See zenCELL owl
live, 30 min, free online

Real cells. Real data. Real comparison. Watch AI cell counting, XYZ stage and full software live inside a real incubator — twice a week via MS Teams.

Full course of live cell imaging

Get your free live online demonstration of the zenCELL owl directly inside an incubator, available twice per week.

Remote-Demo

or